CodeNSolder
I’m writing this mostly for myself.
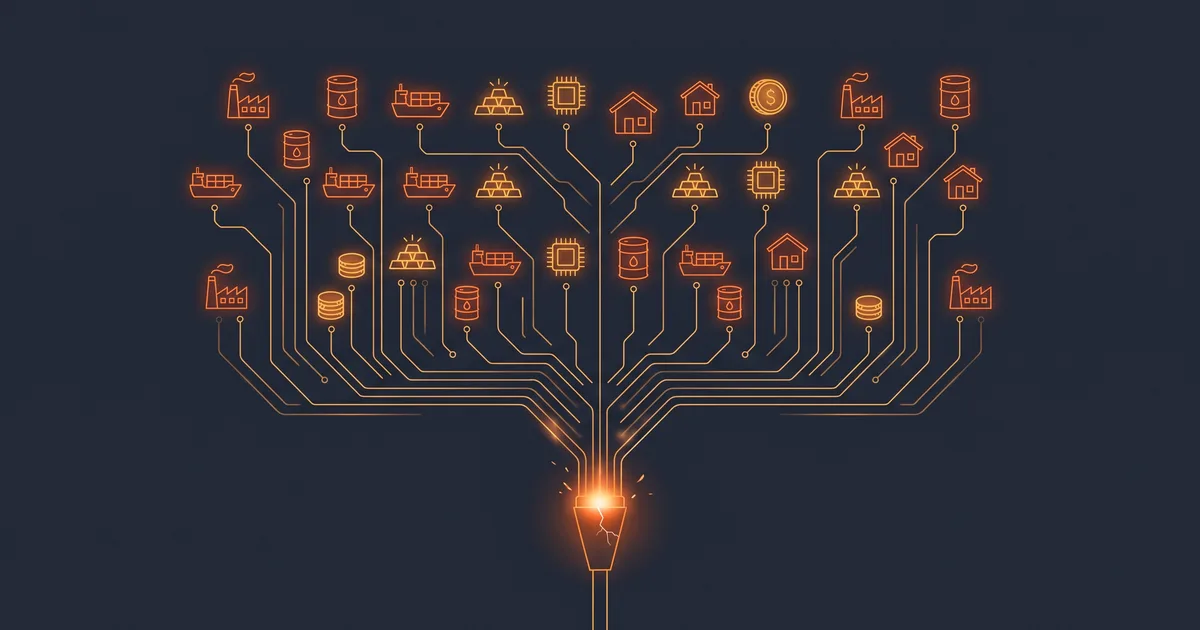
For months I’ve been noticing the same patterns in the news. A war shuts a strait, and India starts worrying about its oil bill. A tariff from Washington got India to rethink buying Russian oil, while the US itself now licenses Russian diesel imports and still lets Russian uranium in under waivers. Gold hit a record in January. Each story makes sense on its own. Together they feel like a system being pushed somewhere it was never designed to go.
I’m an engineer, not an economist. When a system I’ve built starts acting strange, I stop chasing the alerts one by one and look at the design: where the single points of failure are, what feeds into what, what breaks under load. So this is me doing that with the world economy, thinking out loud, to clear my own head and decide what I should do. I don’t need to win. I’d like to come out of it alive.
There’s a bigger question under all this, and I’ll come to it in part 2. Life on Earth has been through five mass extinctions, each wiping out roughly three-quarters or more of all species, all from natural causes. Many biologists think a sixth has started, caused by us, with other species paying so far. I keep wondering if we’re slowly setting one up for ourselves too.
A car, priced in gold
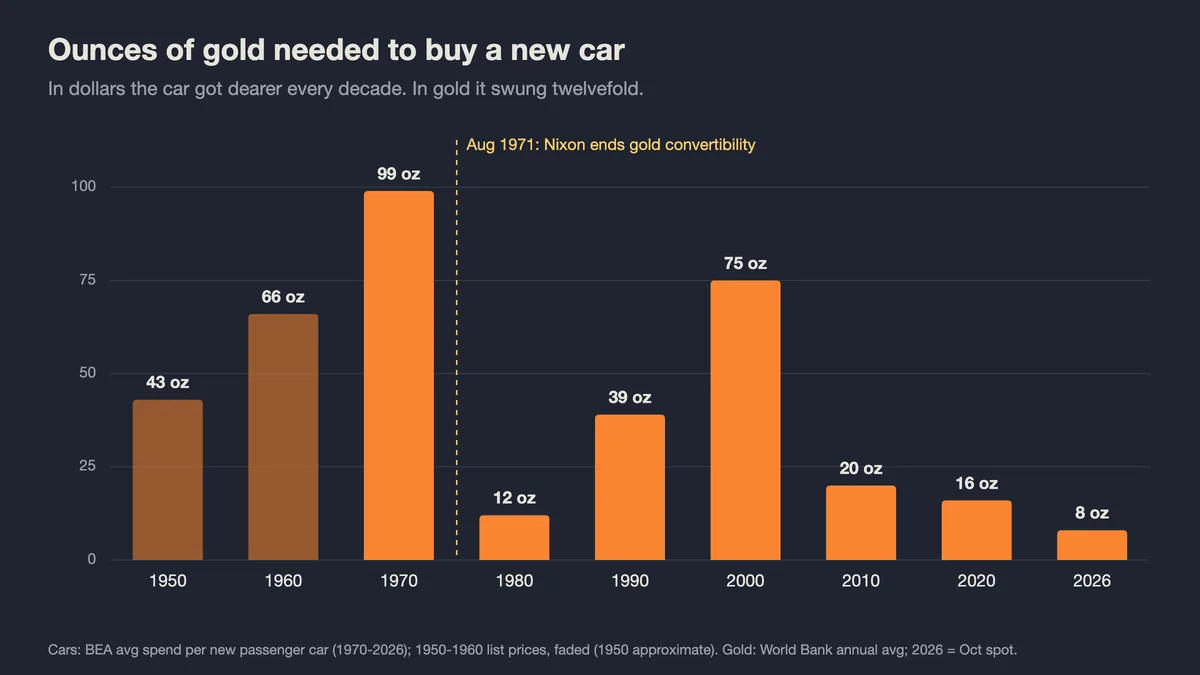
I started with a simple question: what did a family car cost in gold, decade by decade?
| Year | New car | Gold (per oz) | Gold per car |
|---|---|---|---|
| 1950 | ~$1,500 | $35 | ~43 oz |
| 1960 | $2,316 | $35 | 66 oz |
| 1970 | $3,542 | $36 | 99 oz |
| 1980 | $7,574 | $608 | 12 oz |
| 1990 | $15,045 | $383 | 39 oz |
| 2000 | $21,039 | $279 | 75 oz |
| 2010 | $24,898 | $1,225 | 20 oz |
| 2020 | $27,583 | $1,770 | 16 oz |
| 2026 | $34,101 | ~$4,100 | 8 oz |
Car prices from 1970 are the US Bureau of Economic Analysis average spend per new passenger car, excluding SUVs and pickups (2026 is January to July). 1960 is a Chevrolet Biscayne sedan’s list price; 1950 is an approximate price for a basic Chevrolet. Gold is the World Bank annual average London price (so 1970 shows $36, against the official $35), except 1950 (the legal price) and 2026 (October spot, below the year’s average after January’s record).
In dollars, the car got more expensive in every single decade, about 23 times since 1950. In gold it went everywhere: 99 ounces, then 12, then 75, and now 8, the lowest in the whole table.
What Nixon actually did
Look at 1970. Officially gold was still $35 an ounce, where it had been in 1950, while car prices had more than doubled. Gold’s price was frozen and everything else went up, so the $35 promise had stopped being believable.
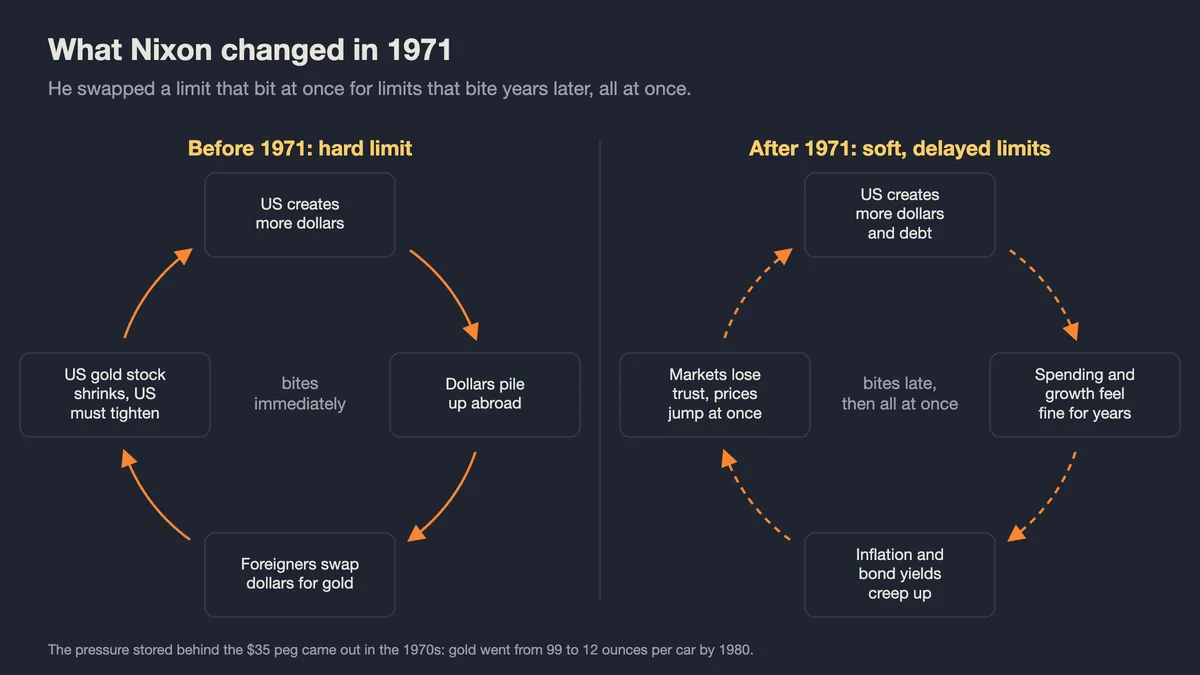
After World War II, foreign central banks could swap dollars for gold at $35 an ounce, and no other currency had that deal. To me that’s a balancing loop with a hard limit: if the US printed too many dollars, foreigners would cash them in for gold, America’s gold pile would shrink, and Washington would have to tighten.
The economist Robert Triffin spotted the trap in 1960. A growing world needed more dollars, the only way to supply them was for the US to keep sending more abroad than it took back, and sooner or later there would be far more dollars overseas than gold in Fort Knox. US gold reserves fell by more than half between the late 1940s and 1971.
On 15 August 1971 Nixon went on television and said he was suspending “temporarily” the dollar’s convertibility into gold. It was never restored.
As an engineer, I read it like this. Nixon took out the hard limit and put in soft, slow ones: inflation, and how long bond markets are willing to keep lending. A hard limit bites immediately. A soft one bites late, and then all at once. You can see it in the table. The pressure built up behind the peg came out over the next decade, and by 1980 a car cost 12 ounces of gold instead of 99, with American inflation in double digits.
The experiment we’re all living in
Since 1971 the whole world has been running a monetary experiment, and none of us signed up for it.
Money isn’t dug out of the ground any more. It’s printed out of thin air. Central banks create it with a keystroke: the US Federal Reserve’s balance sheet went from under $1 trillion before the 2008 crisis to about $9 trillion in 2022. Commercial banks create it every time they make a loan. Governments borrow and almost never pay the debt back. They refinance it, rolling old bonds into new ones, and let growth and some inflation shrink it relative to the economy. The US did exactly that after World War II: debt fell from about 106% of GDP in 1946 to about 25% by the mid-1970s, partly through growth and partly through inflation.
The bet underneath all of it is that the future will be bigger than the past: that growth will keep coming, and that the next generation will carry whatever is left of the bill. For decades it kind of worked, because the economy kept growing and trade kept flowing. I can see at least five places where that bet is now under stress.
Stress lever: the printer
COVID showed how far the dial can turn. I’d read that 70 or 80 percent of all the dollars in existence were printed during and after COVID. When I checked, that turned out to be a chart artifact: in May 2020 the Fed changed its definition of M1 and moved about $11 trillion of savings deposits into it overnight. The broader M2 money supply went from about $15 trillion in early 2020 to about $22 trillion two years later, roughly 40% more dollars in two years.
Stress lever: de-dollarisation
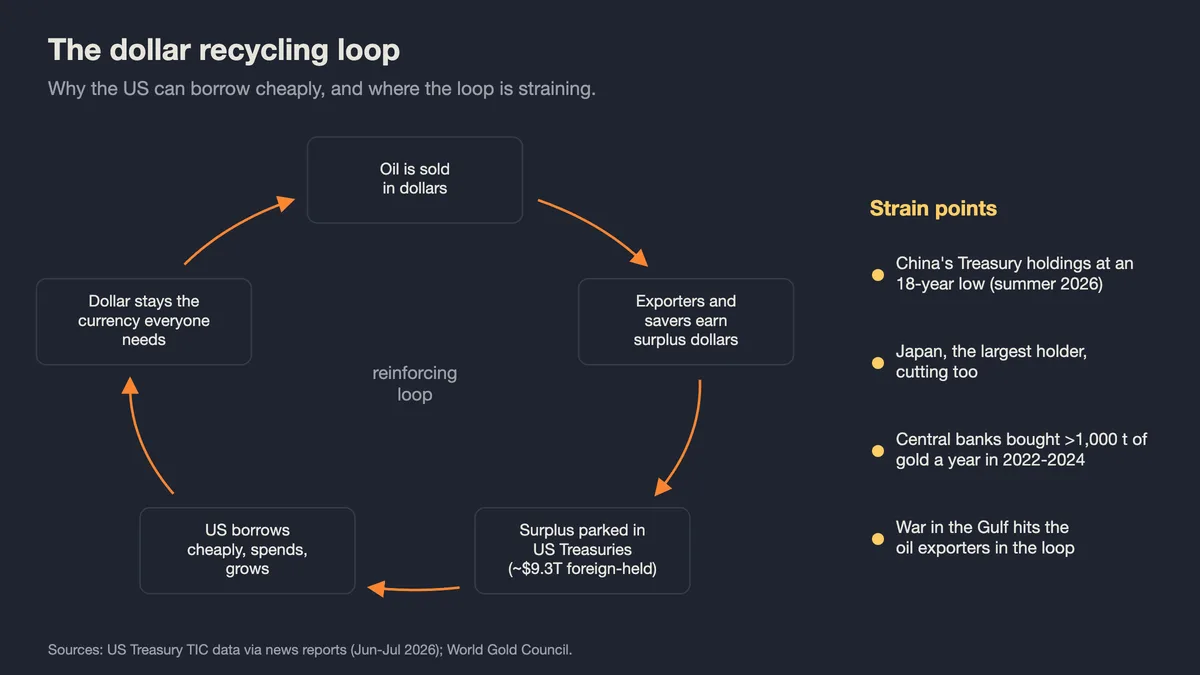
The printer can keep running because the whole world needs dollars. Oil is sold in dollars, so every country that buys oil needs them. Countries that earn more dollars than they spend, oil exporters among them, park the surplus in US Treasury bills and bonds. That lends the money back to Washington cheaply, America spends and grows, and the dollar stays the thing everyone needs. Foreigners hold about $9.3 trillion of US Treasuries today. A French finance minister called this America’s “exorbitant privilege”. Countries without that demand, like Zimbabwe, Venezuela and Argentina, found the limit of the experiment fast.
That loop is straining. China’s holdings of US Treasuries fell to an 18-year low this summer, and Japan, the largest foreign holder, has been cutting too. Central banks bought more than 1,000 tonnes of gold a year from 2022 to 2024, a record run. I read every one of those decisions as a small vote for holding something other than the dollar. If enough of the world stops recycling its dollars into Treasuries, the US loses the cheap borrowing that the rest of this section depends on.
Stress lever: the debt magic
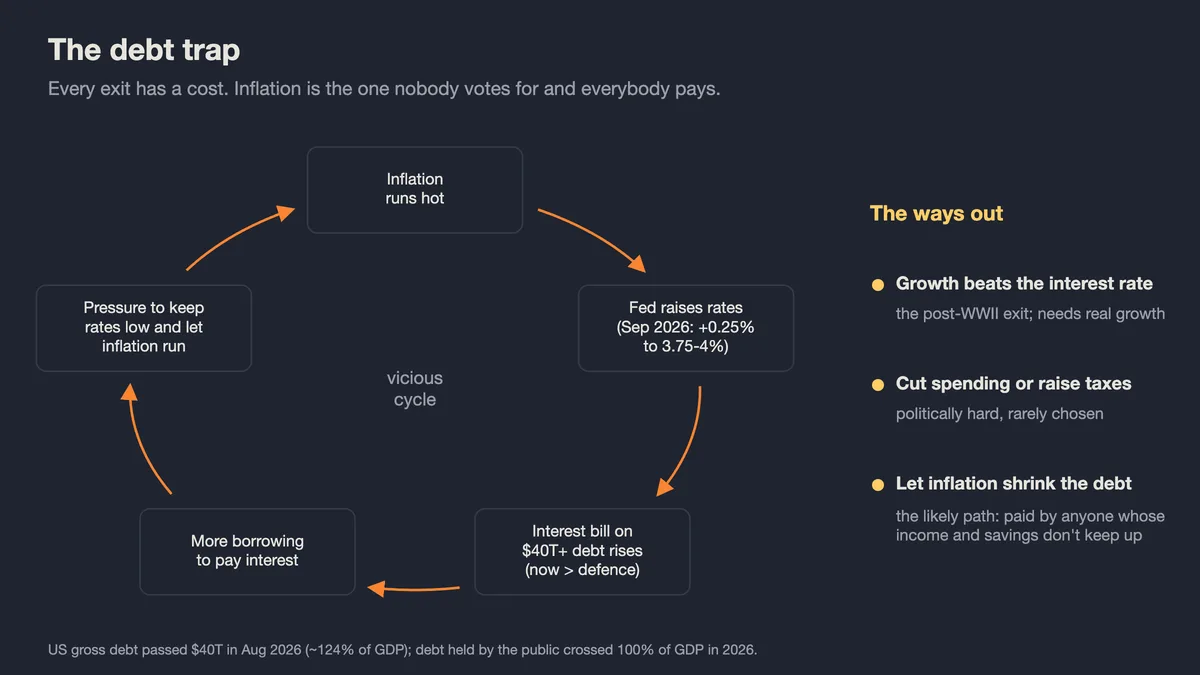
The US now owes more than its whole economy produces in a year. Debt held by the public crossed 100% of GDP this year, a level it had only reached at the end of World War II and, briefly, in the 2020 pandemic slump. Gross debt passed $40 trillion in August, about 124% of GDP, and the country now spends more on interest than on its military.
In September the Fed did the textbook thing against inflation and raised rates a quarter point, to 3.75 to 4%, its first rise since 2023. President Trump replied within hours that rates “should be 1%, or less”. From where he sits that’s rational. Every rate rise makes the interest bill on $40 trillion bigger, which means more borrowing, which means more interest. Not raising rates lets inflation run instead. I keep going round this loop and I keep landing in the same place: the debt gets handled the way it was after World War II, by letting inflation shrink it.
That only works out for the rest of us if our incomes grow faster than prices, and I’m not counting on it. AI is already eating into entry-level work. Stanford researchers who track this found that by mid-2026, employment for 22-to-25-year-olds in the most AI-exposed jobs was about 19% below where it would have been had it kept pace with less exposed jobs. Forget growth; I’d settle for keeping up.
Stress lever: what the borrowing buys
What bothers me most is where the borrowed money goes. Borrowing to build roads and power grids can pay for itself. More and more of it goes to transfers instead, and in election years to what looks to me like free money in exchange for votes.
India is full of examples. Twelve states budgeted ₹1.68 lakh crore for 2025-26 on unconditional cash transfers to women, according to PRS Legislative Research: Madhya Pradesh’s Ladli Behna Yojana pays ₹1,500 a month, Maharashtra’s Ladki Bahin started at ₹1,500, and Jharkhand’s Maiyan Samman pays ₹2,500. Across the twelve states that’s about 0.5% of India’s GDP, up from 0.2% two years earlier, and six of them expected to run revenue deficits. The Reserve Bank of India itself warned in December 2024 that loan waivers, free electricity and cash transfers risk crowding out spending on roads, schools and hospitals.
I don’t think helping people is wrong. But there’s no free lunch. Money borrowed for handouts is money not spent on things that pay for themselves, and the debt is still there afterwards. My own view is that when more people have more money without more being made, prices drift up, and everyone who holds the currency pays. That bill will bite us eventually.
Stress lever: the house
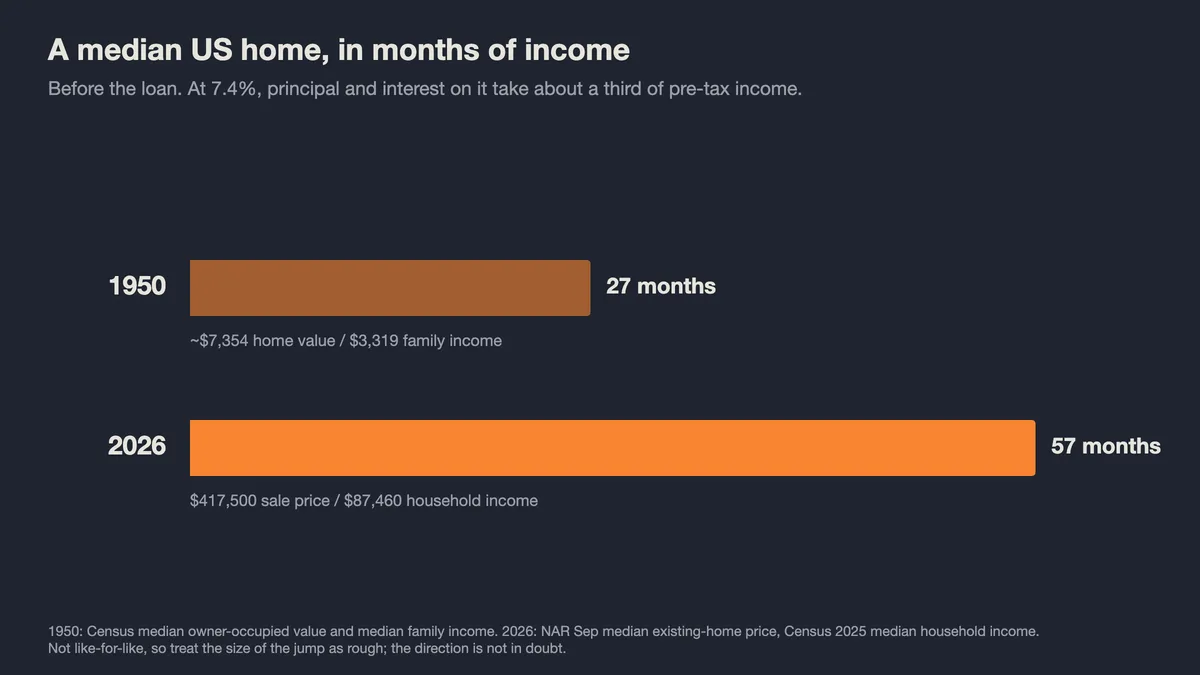
Housing is where I can see the whole experiment in one number. In 1950 the median owner-occupied American home was valued at about $7,354, and the median family earned about $3,319 a year, so a house cost about 27 months of income. In September 2026 the median existing home sold for $417,500, and the median household earned $87,460 in 2025, so a house now costs about 57 months of income. The two ends aren’t measured quite the same way (an owner’s estimate and family income then, a sale price and household income now), so the size of the jump is rough. The direction isn’t, and that’s before anyone pays today’s mortgage rates.
What it looks like from where I sit
Here in India, the cash in circulation grew 13.5% in a year, its fastest since the pandemic years, and the rupee kept hitting record lows, past 96 to the dollar by May, as the war pushed up our oil bill. I can’t control any of that. But the arithmetic is simple: if my income and savings grow slower than the money around them, I get poorer every year without noticing.
The long-term version scares me more. Pensions run on the same growth bet. The main US retirement trust fund is projected to run dry in late 2032, after which incoming taxes cover only about 78% of promised benefits. Birth rates are falling almost everywhere, India’s now below replacement too. With fewer workers paying in and savings quietly losing value, retirement money can run out before the retirees do.
Underneath all of this sits an assumption I no longer believe: that economies can grow forever, and keep growing while trade gets chopped up by tariffs. Nothing grows forever.
A system with no slack
Trade was built on the same kind of bet. In 1817 David Ricardo showed that two countries both gain if each specialises in what it’s relatively best at and they trade. Add the shipping container in the mid-1950s, decades of tariff cuts, and China joining the WTO in 2001, and you get the world I grew up in. My phone was designed in California, assembled in China or India, and runs on chips from Taiwan made with Dutch machines.
Optimising for cost and nothing else removes slack. You make each thing in the one cheapest place, run inventory just-in-time, and skip the second supplier you don’t need today. I’ve spent years building connected hardware, and I would never ship a design where one cheap part failing bricks every device in the field. The first design review catches that. The global economy built itself that way anyway, because on a cost spreadsheet slack looks like waste.
About a fifth of the world’s oil goes through one narrow strait, Hormuz. Most of the most advanced chips come from one company in Taiwan, TSMC, using machines only one Dutch company, ASML, can build. China refines about 85% of the world’s rare earths, which go into motors, magnets and missiles. I knew some of this from my own workbench: several of the IoT projects on this blog run on ESP8266 or ESP32 chips from Espressif, a company in Shanghai. While the world was calm, that never felt like a dependency.
Whoever makes things makes the rules
This is the pattern I’m most sure about. When a country stops making things, it gives away part of its sovereignty. The country that makes the thing gets to set the terms, including the term “no”.
China makes about 28% of the world’s manufactured goods. The US is still the second-largest manufacturer at about 16%, but its manufacturing jobs fell from about 17.3 million in 2000 to about 12.7 million, and it lost, or never built, whole capabilities: consumer electronics, shipbuilding, batteries, solar panels, drug ingredients. The UK went into finance. India went into IT services.
During COVID, rich countries couldn’t make enough masks or basic medicines, and money didn’t help. Germany had built much of its industry on cheap Russian gas, and its energy-heavy industry still hasn’t recovered from losing it in 2022. The US and Europe couldn’t make artillery shells fast enough for Ukraine. In 2025 the UK Parliament was recalled on a Saturday to keep British Steel’s blast furnaces running, because without them the country would have lost the ability to make new steel from iron ore.
Now the countries that moved to services are rebuilding factories, and I read that as an admission that they got it wrong: the CHIPS Act and tariffs in the US, a Chips Act in Europe, Rapidus in Japan, production-linked incentives and a semiconductor mission in India. Even Adam Smith, the patron saint of free trade, made an exception for this: “As defence, however, is of much more importance than opulence, the act of navigation is, perhaps, the wisest of all the commercial regulations of England.”
Meanwhile trade became a weapon. In 2025 the US raised India’s tariffs to 50%, half of it explicitly as a penalty for buying Russian oil, and lifted the penalty in February after India agreed to stop. A tariff changed another country’s energy policy in six months. China answered US tariffs and chip controls by restricting exports of gallium, germanium and rare earths, the same rare earths the US defence industry needs for its magnets.
Security you can’t make yourself
The same logic applies to safety.
The Gulf monarchies spent decades buying their security from the US: bases, jets, interceptor missiles. In the first three weeks of this war alone, Iran fired thousands of drones and more than a thousand missiles at Gulf states. Most get shot down, but each interception spends a missile the Gulf can’t make. One think-tank estimate in March suggested Bahrain might have used about 87% of its Patriot interceptors and Qatar about 40%. One analyst reckoned the UAE was spending $20 to $28 to stop every dollar Iran spent on drones.
If I lived in Doha or Riyadh, this would scare me. My safety depends on someone else’s factory, someone else’s stockpile and someone else’s priorities, and that someone else is fighting its own war. In public, Gulf governments have praised the joint air defence. In private, according to officials who spoke to AP in March, they were frustrated and even angry that the US gave no warning of the strikes, ignored their warnings about the fallout, and didn’t defend them enough.
For decades the US and its allies sanctioned Iran to weaken it. Cut off from buying weapons, Iran built its own, and its Shahed drones got good and cheap enough that Russia bought them for Ukraine. Now those drones and missiles, along with mines and fast boats, are a big part of what lets Iran hold the Strait of Hormuz. Iran’s people paid heavily for the sanctions, and its economy is a mess. Still, the sanctions forced it to make its own weapons, and those weapons are now its leverage. Systems thinkers call this pattern “fixes that fail”.
India sits on both sides. We’re called the pharmacy of the world for generic drugs, yet around 70% of the active ingredients we import come from China. We import most of our crude oil, and a big share comes through Hormuz. And Apple moving iPhone production for the US market to India is one of the clearest cases of a country gaining from the shift.
2026, under load
The US-Israeli war with Iran began on 28 February, and Hormuz has been largely closed since, apart from brief reopenings in April and June. Oil is up about 45%: Brent settled near $105 a barrel on 2 November, and that was after a 7.6% one-day fall on hopes of a deal. At Qatar’s Ras Laffan, the world’s largest LNG export hub, QatarEnergy says repairs will take three to five years, with about 17% of its export capacity offline until then.
In February the US Supreme Court ruled that most of the 2025 tariffs were illegal. A temporary global tariff of up to 15% ran until late July, while separate tariffs on steel, cars and other sectors stayed. Anyone deciding where to build a factory has watched the rules change several times in eighteen months.
Add the debt magic, and an AI boom pulling more electricity than the grids were planned for. I think each of these is survivable on its own. What worries me is that they feed each other, and I can see three loops.
The first is stagflation: oil and tariffs push prices up, workers ask for higher wages to keep up, and prices go up again. That was the 1970s, right after Nixon’s move.
The second is deglobalisation. Tariffs bring retaliation, then trading blocs, then less trust, then more tariffs and more defence spending. The last time the world did this seriously was after the US Smoot-Hawley tariffs of 1930, and most economists think it made the Great Depression worse.
The third is the debt magic from earlier, a trick that works until bond markets stop trusting you.
Timing makes all of it worse. An energy site can be hit in a day and take years to repair. Tariffs appear overnight, while moving a factory often takes three to five years. Data centres go up in a year or two, but the power plants and grid lines that feed them can need five to ten. When the shocks are fast and the fixes slow, systems overshoot in both directions.
From efficiency to security
The biggest change, I think, is that governments have changed what the system is for. For most of the last 75 years, and especially since about 1990, the goal was efficiency: make it wherever it’s cheapest. The goal now is security: make the important things somewhere you trust. Donella Meadows, who wrote the best short book on systems thinking, ranked changing a system’s goal near the top of all the ways a system can change. That’s why I don’t expect this to pass like a normal shock.
Security costs money, because it means paying for redundancy, which is exactly the slack we spent decades removing. TSMC’s Arizona plants ran into higher costs and a shortage of skilled workers. Modern factories are heavily automated, so reindustrialisation brings back capacity far more than jobs. The bill arrives as higher prices, which feeds straight back into the stagflation loop.
The stress I’ve barely touched
I’ve only brushed past AI so far, and I think it’s the biggest stress of all.
It touches every part of this system at once. It needs huge amounts of electricity just when energy is scarcest: the IEA expects data-centre power demand to roughly double by 2030. It runs on the tightest chokepoint in this post, those Taiwanese chips and Dutch machines. Export controls now decide which countries get to build it. And by one ING estimate, AI investment accounts for roughly a third of US economic growth, which makes it part of the bet that the future will be bigger than the past.
The part that matters most to me is labour. The efficiency era moved work to wherever labour was cheapest: factories left Ohio for Shenzhen, software work came to Bangalore. Each move still sent the work to other people.
AI is the next source of cheaper labour, and this time the work doesn’t go to another country’s workers. It goes to machines owned by a handful of companies in a handful of places, which is the “whoever makes things makes the rules” pattern again, at a bigger scale.
What I’m going to do about it
I sat with myself on this, and I don’t see any great edge I have over AI in the next three to five years if it keeps growing at this pace.
So 2027 is the year I work on skills that stay useful whichever way this goes: some to keep my own thinking alive next to AI, some to get by in a world with less slack.
- Critical reasoning without asking AI first. I’ll think a problem through on my own before I reach for a model, so the muscle doesn’t waste away.
- Running my own experiments and drawing my own conclusions from what I’ve tested, instead of trusting a summary.
- Finding patterns and anti-patterns in everyday life. That’s what this post is, really, and I want to get better at it.
- Reading more, and writing more: reading to keep feeding the pattern-finding, writing to find out what I actually think.
- Public speaking, and making videos people want to watch. If machines can make endless content, a real person explaining something they’ve done should count for more.
- Physical computing, building things that touch the real world: hardware, sensors, things I can solder and hold.
- Growing more of my own food. I already grow a few vegetables on the balcony, and food is the most basic dependency of all.
- Reading paper maps. It sounds old-fashioned, but it’s a small, real backup for the day the phone and the network aren’t there.
Underneath the list is the same rule I’d use for a system I was designing: keep some slack, avoid single points of failure where I can, and watch the stress markers instead of the headlines.
In part 2 I’ll go after the harder question: what happens to people, me included, when the work goes to machines? What stays human when AI can do most of the rest? And if a sixth extinction is coming for us, does it look like an asteroid, or like everything in this post, piling up quietly until something gives?